A business team allocating crores across partner banks, by writing a sentence. Designed before conversational AI made this feel obvious.
The catch: someone must decide, for every single loan, which partner bank it goes to, matching each bank’s risk appetite, product policy, and appetite for volume. Daily.
There was no PRD. No user flows, no problem statement. The preliminary requirements were vague, and the business team walked in with an Excel sheet and a sentence that still makes designers flinch:
“We have designed the UI. Just replicate it in Figma.”
| Axis | CBI | RBL | ICICI | |||||
|---|---|---|---|---|---|---|---|---|
| Leads | Amount | Leads | Amount | Leads | Amount | Leads | Amount | |
| Axis | Eligible w/ Partner 1 only | Eligible w/ Partner 1 only | Eligible w/ 1 & 3 | Eligible w/ 1 & 3 | Eligible w/ 1 & 4 | Eligible w/ 1 & 4 | ||
| CBI | Eligible w/ 1 & 2 | Eligible w/ 1 & 2 | Eligible w/ Partner 2 only | Eligible w/ Partner 2 only | Eligible w/ 2 & 3 | Eligible w/ 2 & 3 | Eligible w/ 2 & 4 | Eligible w/ 2 & 4 |
| RBL | Eligible w/ 1 & 3 | Eligible w/ 1 & 3 | Eligible w/ 3 & 2 | Eligible w/ 3 & 2 | Eligible w/ Partner 3 only | Eligible w/ Partner 3 only | Eligible w/ 3 & 4 | Eligible w/ 3 & 4 |
| ICICI | Eligible w/ 1 & 4 | Eligible w/ 1 & 4 | Eligible w/ 4 & 2 | Eligible w/ 4 & 2 | Eligible w/ 4 & 3 | Eligible w/ 4 & 3 | Eligible w/ Partner 4 only | Eligible w/ Partner 4 only |
| Total | Total of P1 (unique) | Total of P1 (unique) | Total of P2 (unique) | Total of P2 (unique) | Total of P3 (unique) | Total of P3 (unique) | Total of P4 (unique) | Total of P4 (unique) |
| Eligible | Being sent to P1 | Being sent to P1 | Being sent to P2 | Being sent to P2 | Being sent to P3 | Being sent to P3 | Being sent to P4 | Being sent to P4 |
Hard to parse? It was hard for everyone, not just me. So instead of replicating it, I read between the lines. What the matrix actually encoded wasn’t a screen; it was a set of decisions the ops team was making every day about partner overlap, exclusivity, and residual pools.
| Lead Id | Product Id | Overall Status | Assigned Partner | Lead Processing Status | Outstanding Principal | Rate of Interest |
|---|---|---|---|---|---|---|
| SCUBL0001A65 | UBL | RECEIVED | YUBI | FAILURE | 5,13,706 | 17.49 |
| SCUBL0001A66 | UBL | RECEIVED | , | PENDING | 8,20,450 | 16.75 |
| HLSA0001B12 | HL | RECEIVED | , | PENDING | 42,10,000 | 9.15 |
| HLSA0001B13 | HL | RECEIVED | , | PENDING | 38,75,200 | 9.40 |
| LAPC0034F09 | LAP | RECEIVED | , | PENDING | 1,10,00,000 | 11.20 |
The handover said replicate the spreadsheet. Instead, I scheduled calls with the two people who actually lived inside it, the Credit Strategy team in Kurla. What they described wasn’t a UI requirement. It was a weekly ritual held together by meetings, favours, and very large spreadsheets.
“By the time the meeting ends, I know exactly how the loans should be split. The next three days are spent making the spreadsheet agree with me.”
“There is no platform. I mail the sheet to whoever can run the engine, wait, get a sheet back, and then the real work starts, row by row.”
What Sujata and Deepa described on our calls, laid end to end. The decision took an hour. Everything after it took days.
Team decides which loans, how many, and to which banks, based on current capacity, business-head guidelines, and available partners.
The meeting ends with a shared understanding of how loans should be assigned. It lives in heads and meeting notes.
Excel sheets are sent to developers or product managers to run through the Business Rules Engine. There is no platform.
The BRE output lands back as spreadsheets, eligibility verdicts across thousands of rows.
Sujata and Deepa sit with the sheets and start assigning loans to banks manually, reconciling against what the meeting decided.
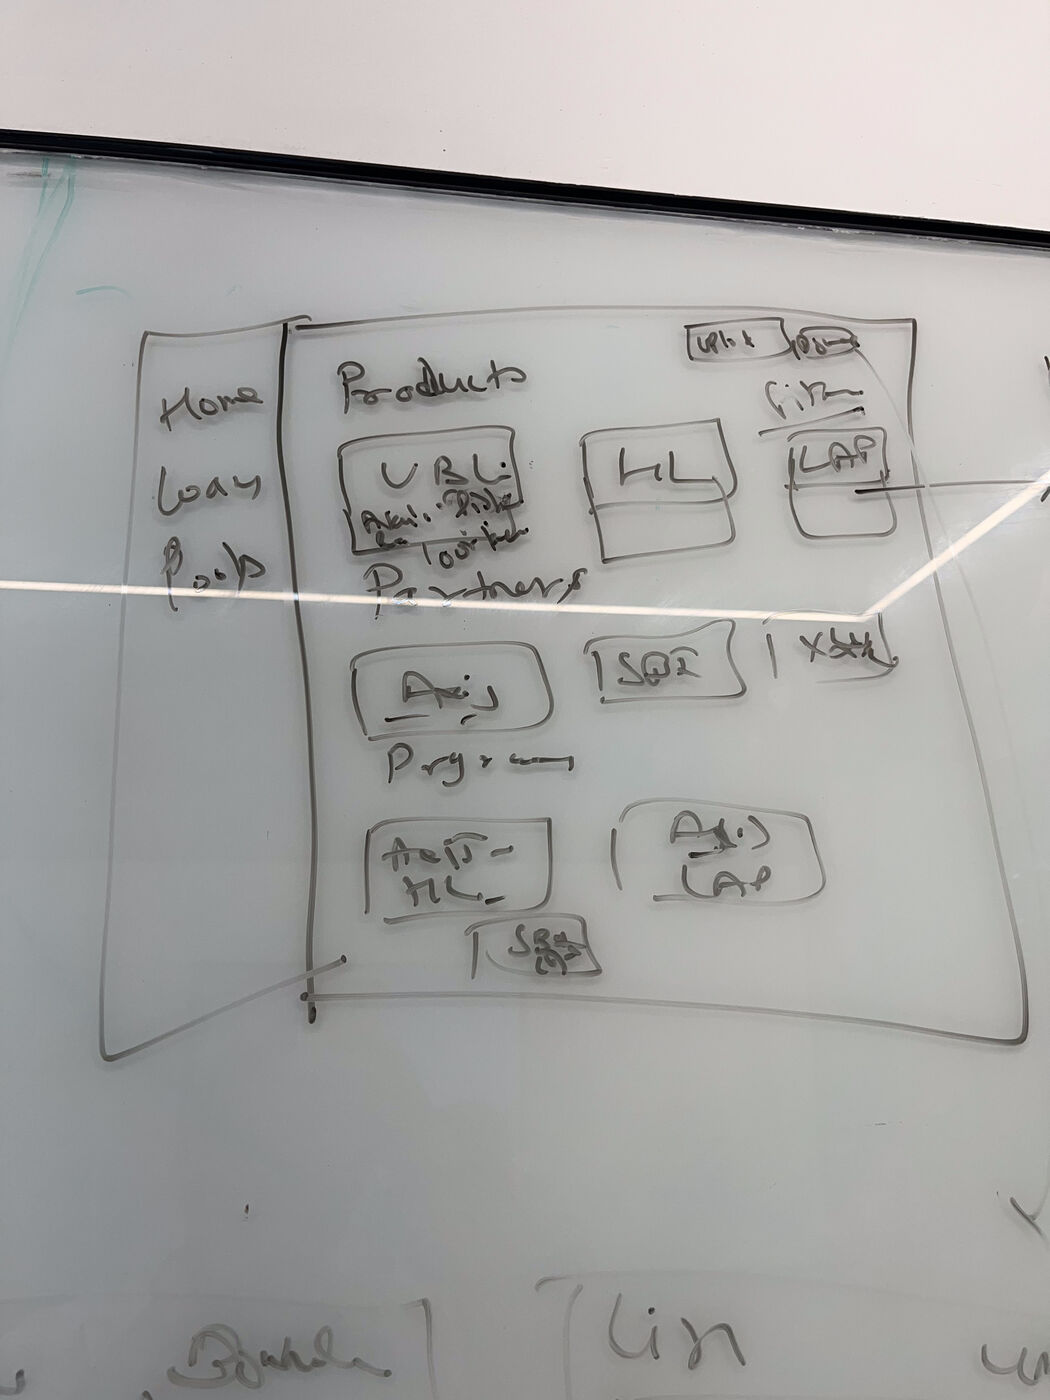
This project was drawn before it was designed. The information architecture went up on office glass; the core idea was literally scribbled on a desk with a marker.

Products (HL, LAP, UBL) × Partners (Axis, SBI…) × Programs. The IA had to hold a matrix that business could grow without redesign, new partner banks were signing every quarter. This was sketched while discussing the initial brief with a product manager.

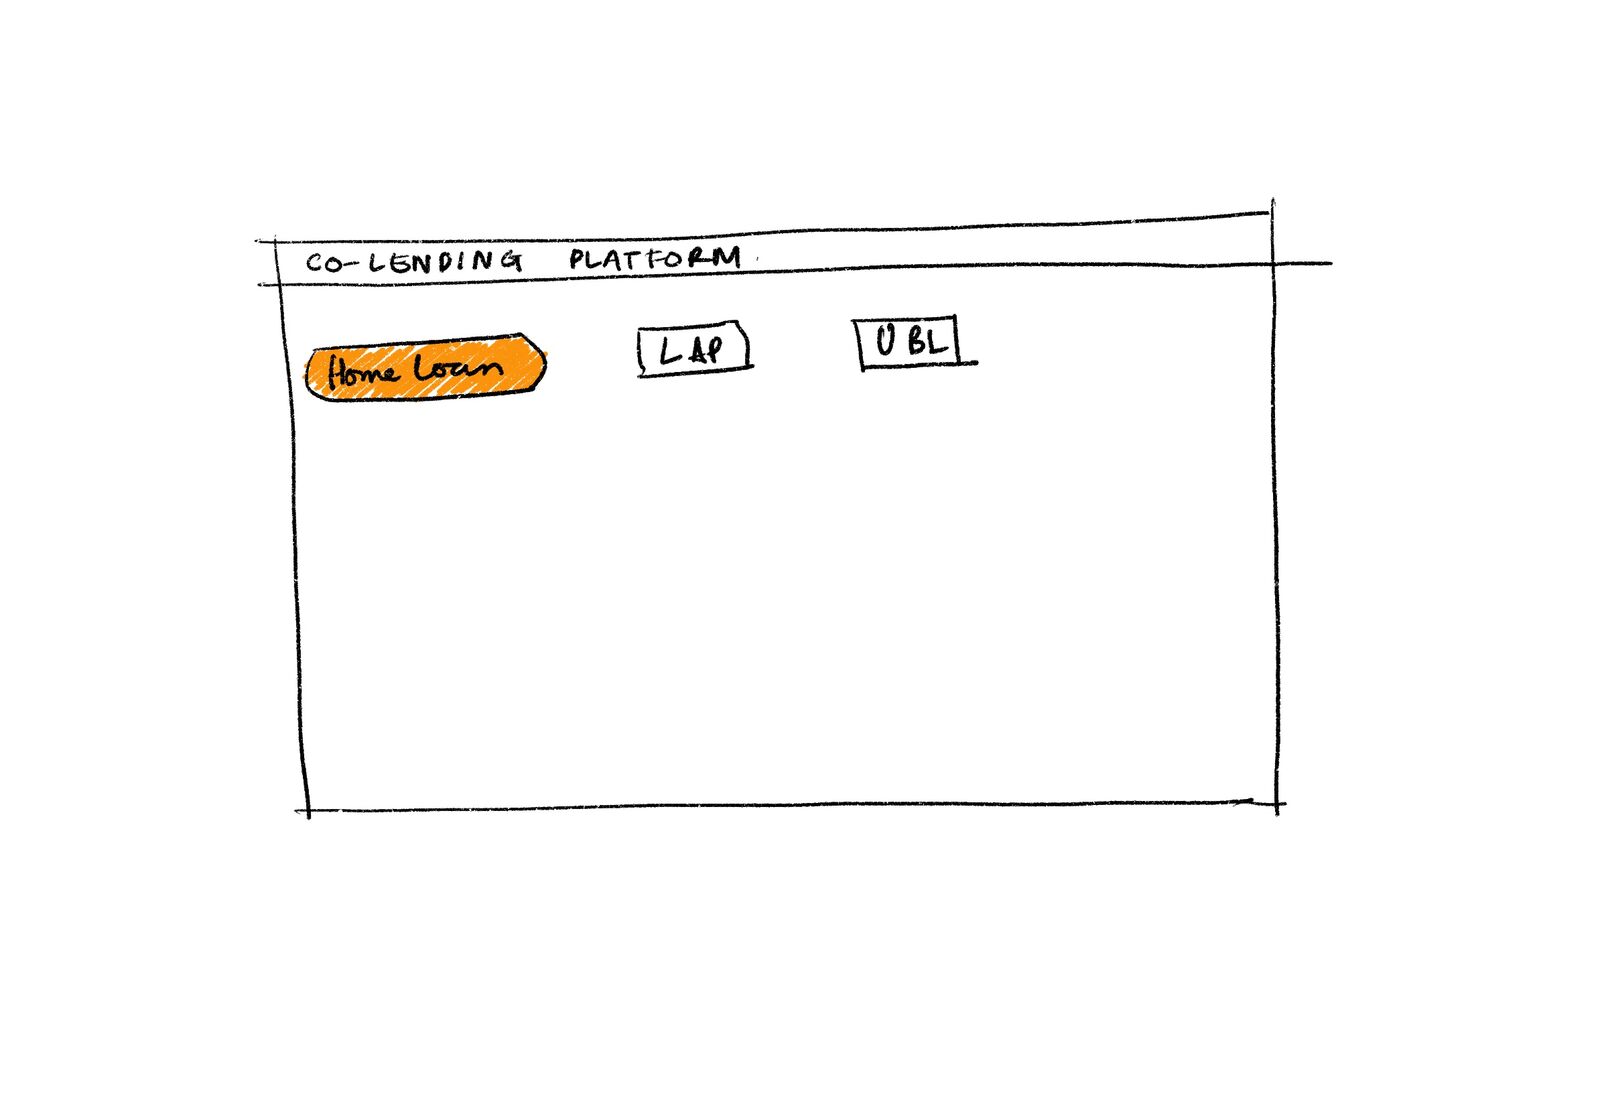
Product-first navigation. Every allocation session starts by answering “which book am I working today?”, Home Loan, LAP, or UBL.

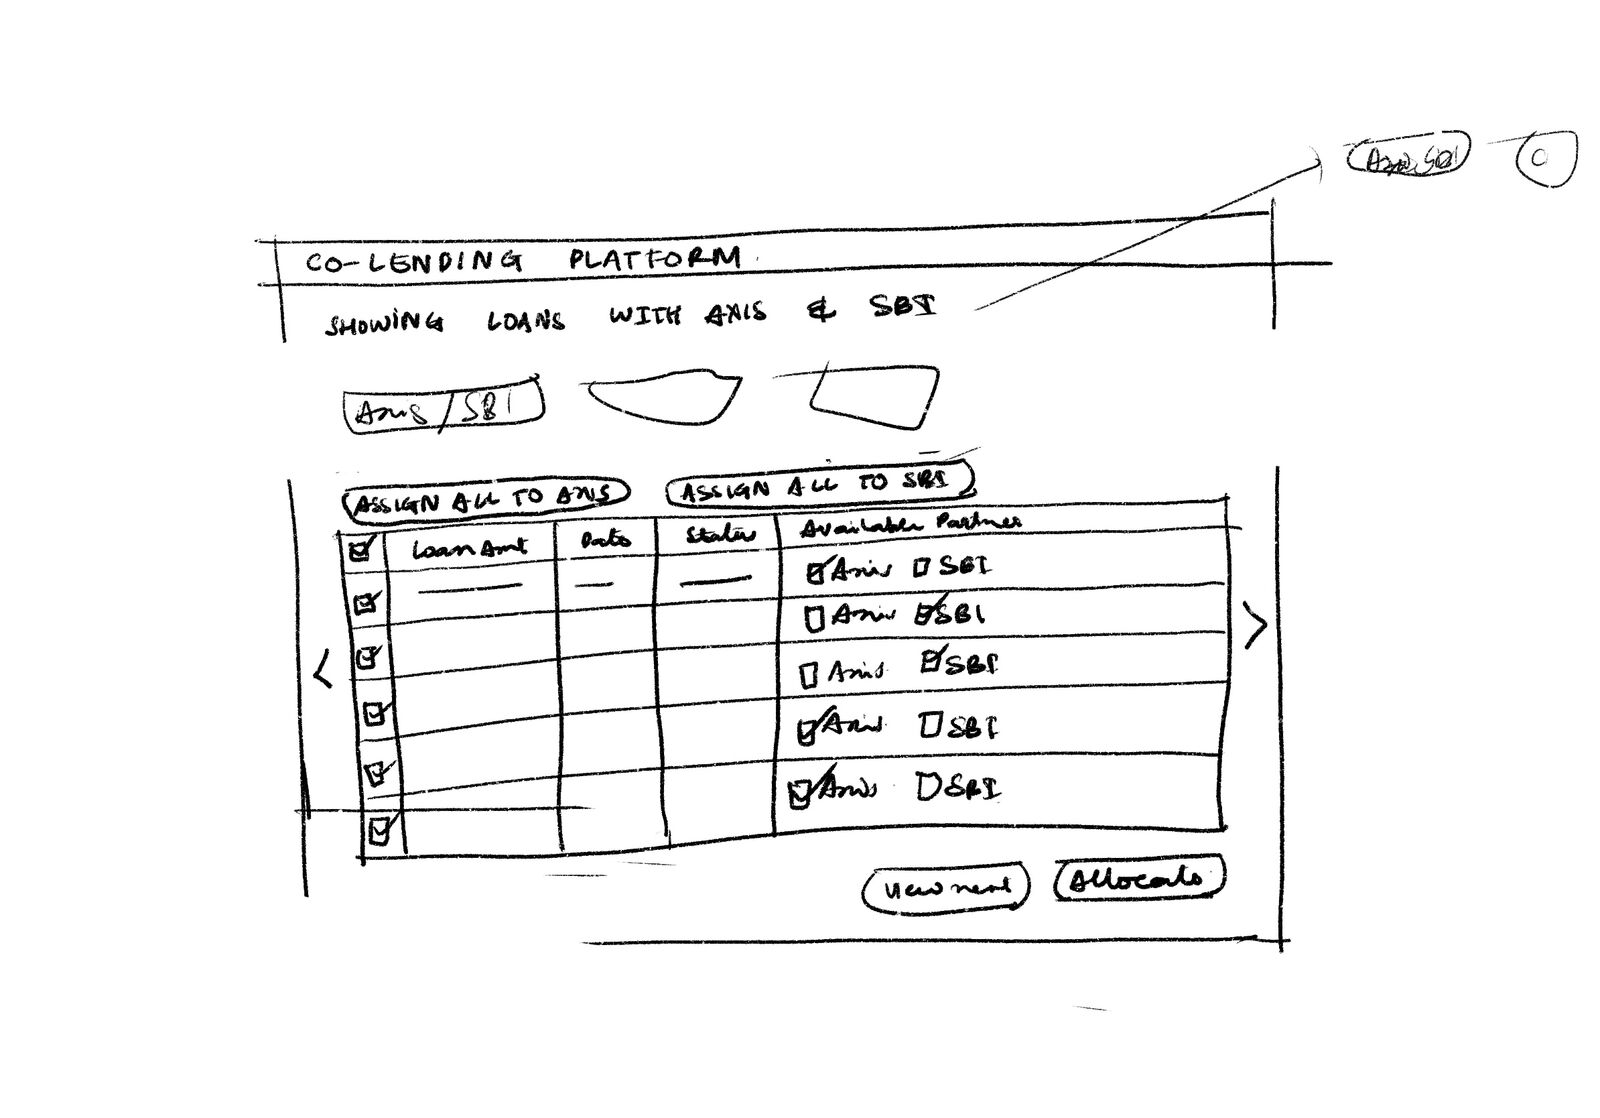
Loans with eligible partners as checkboxes, “assign all to Axis / SBI” shortcuts. Better than Excel, but still asking ops to make 10,000 micro-decisions. It felt like faster manual labour, not a different job.
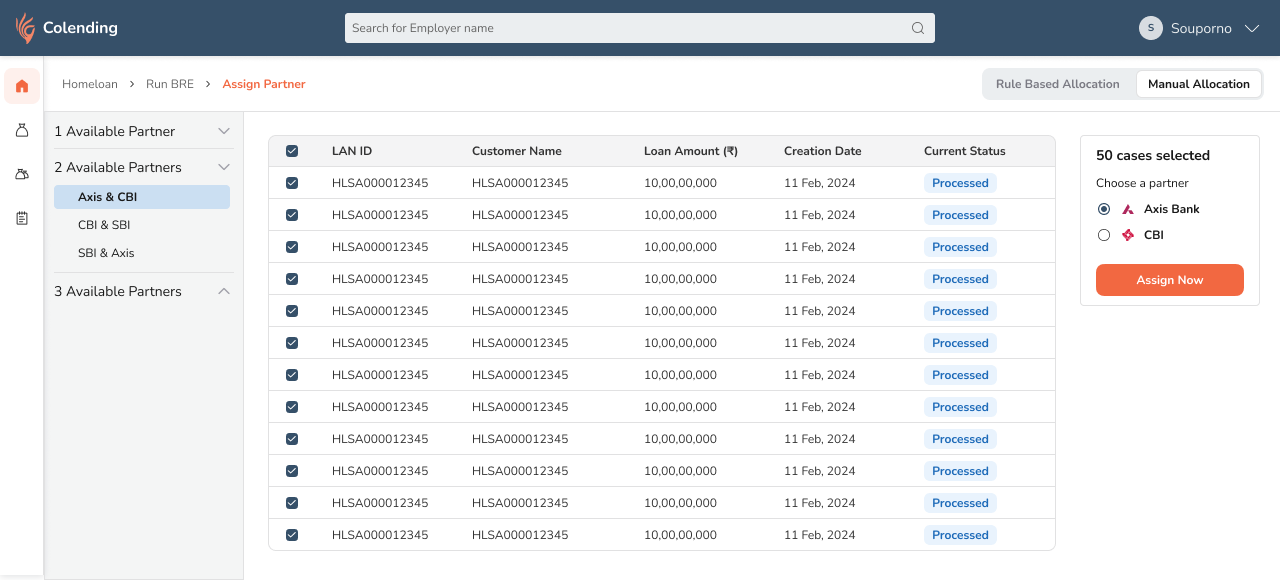
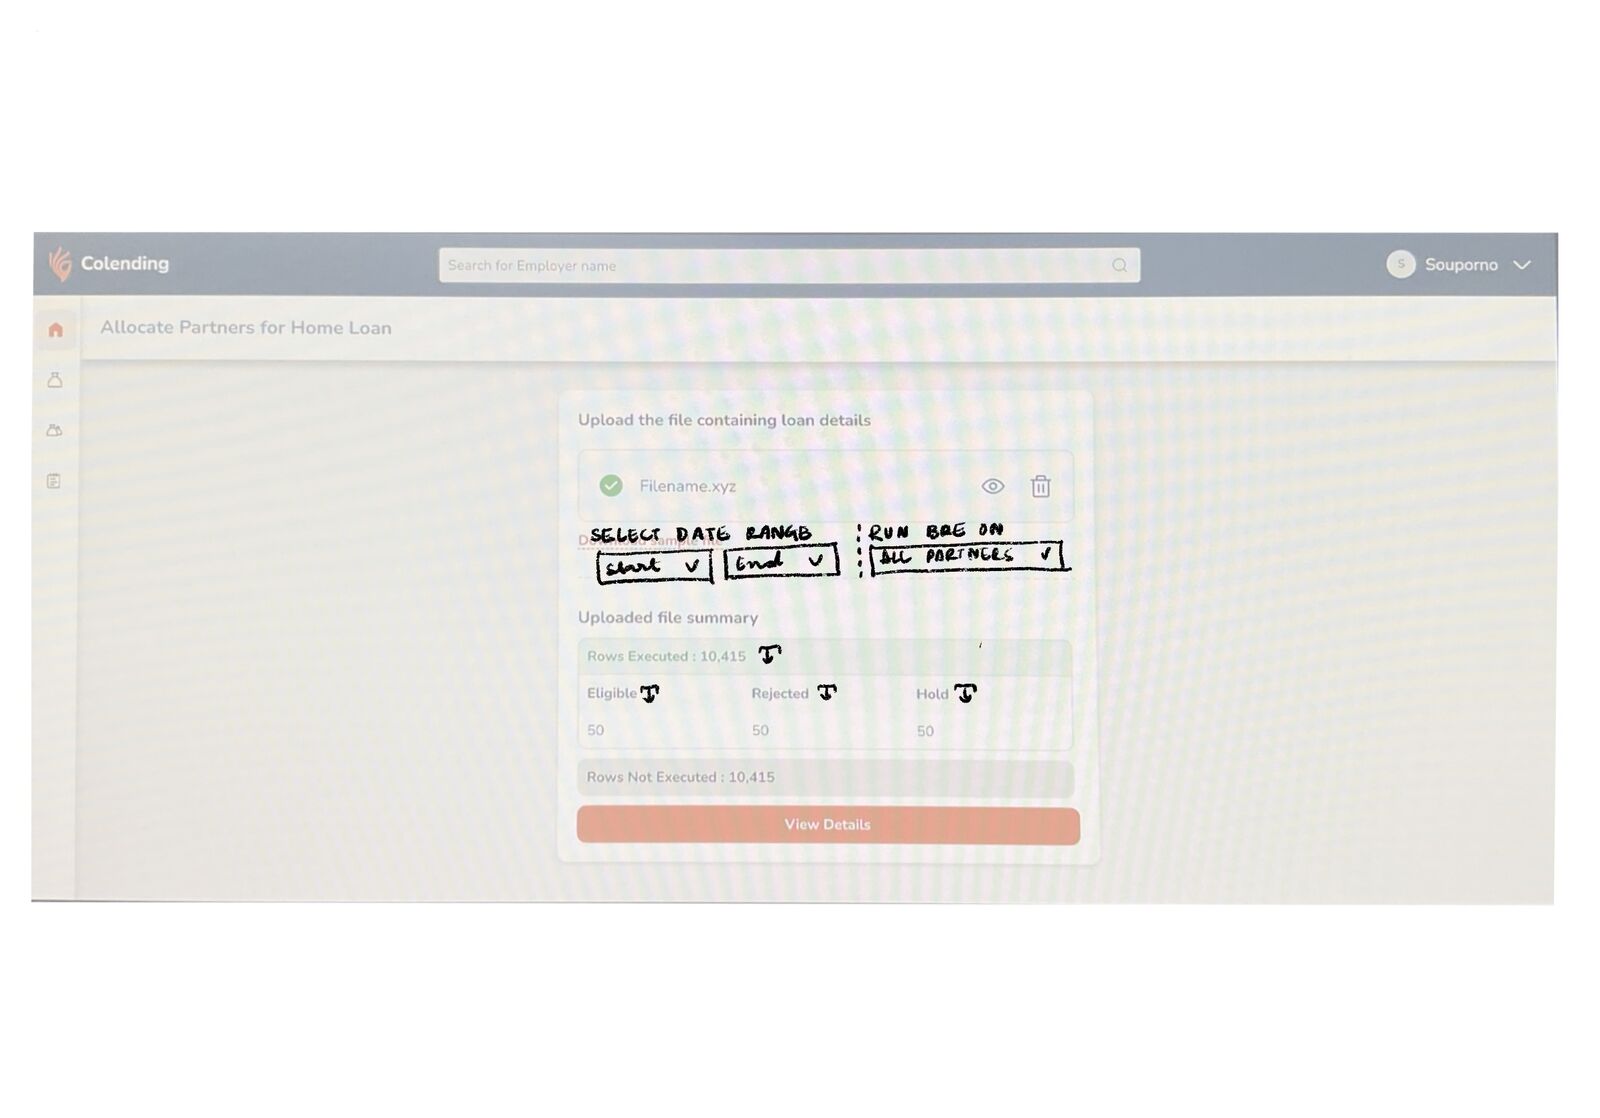
The first two options came out of brainstorming sessions, competent, expected, table-centric. They’re preserved in the Figma file’s “Presentation” page as the roads not taken.

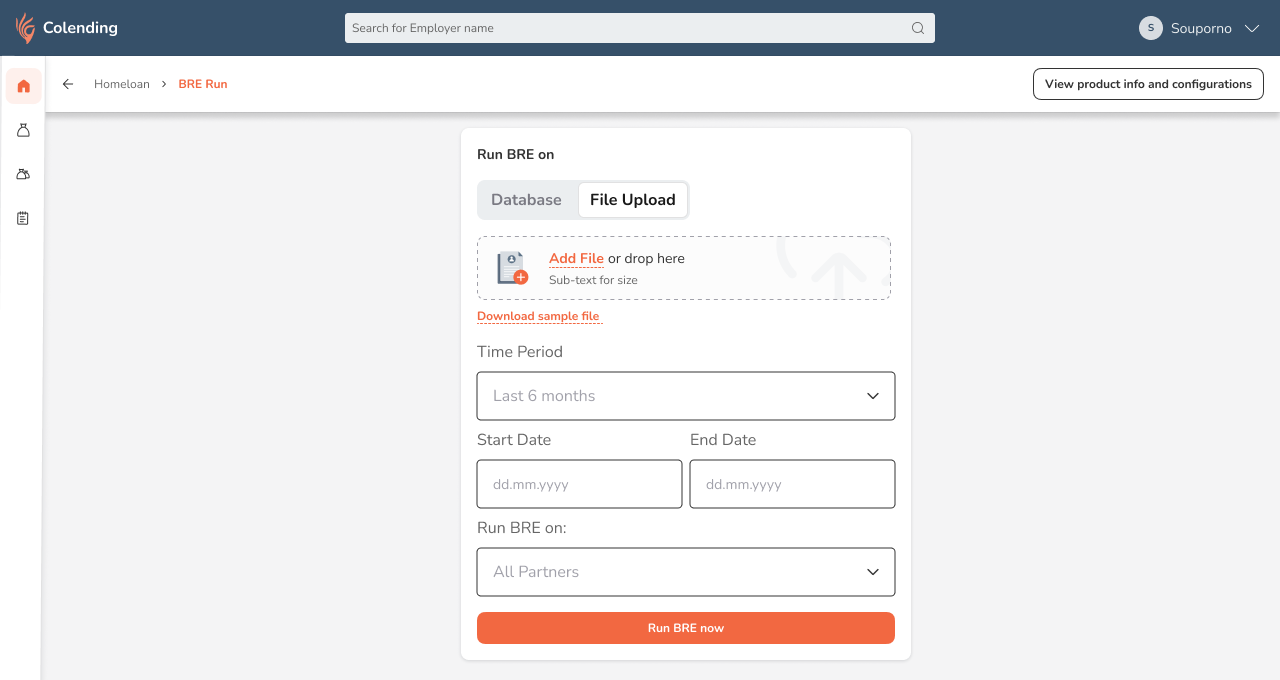
Upload the business file, run the BRE (business rules engine) on every row, and return a verdict: eligible, rejected, hold. 10,415 rows executed in one pass. The human should judge, not scan.

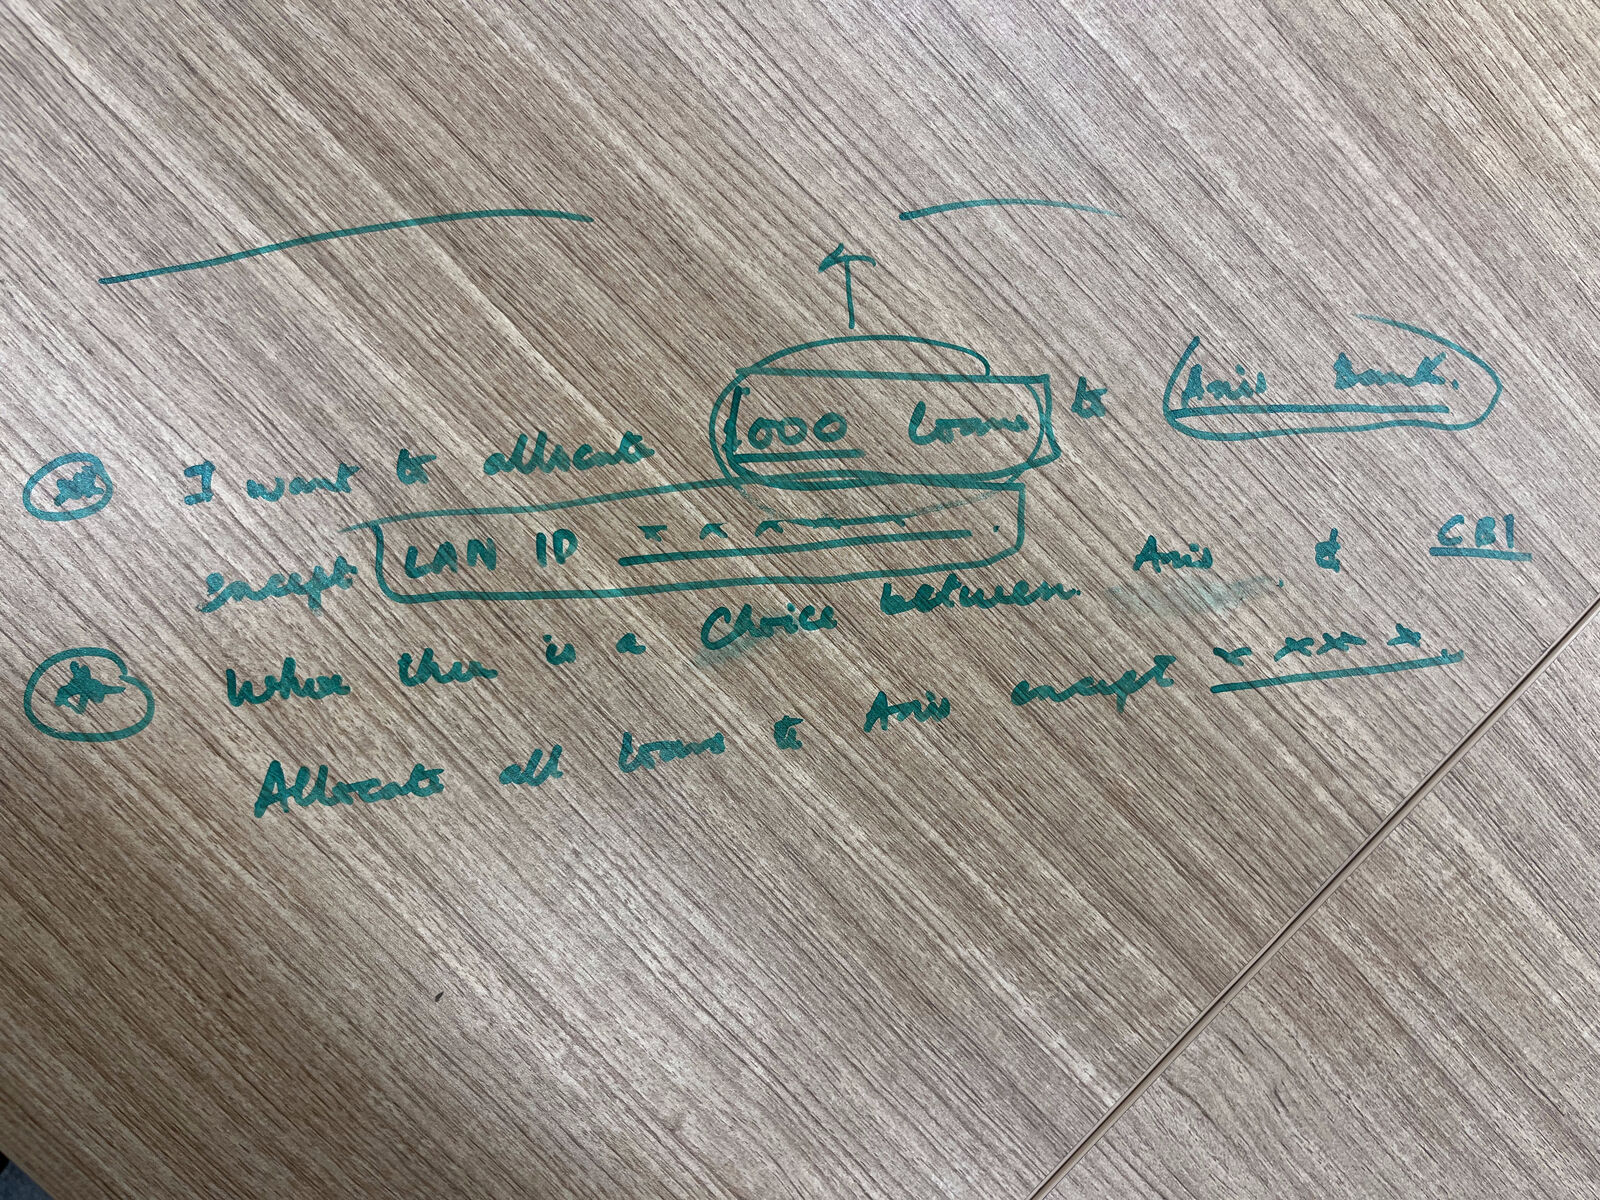
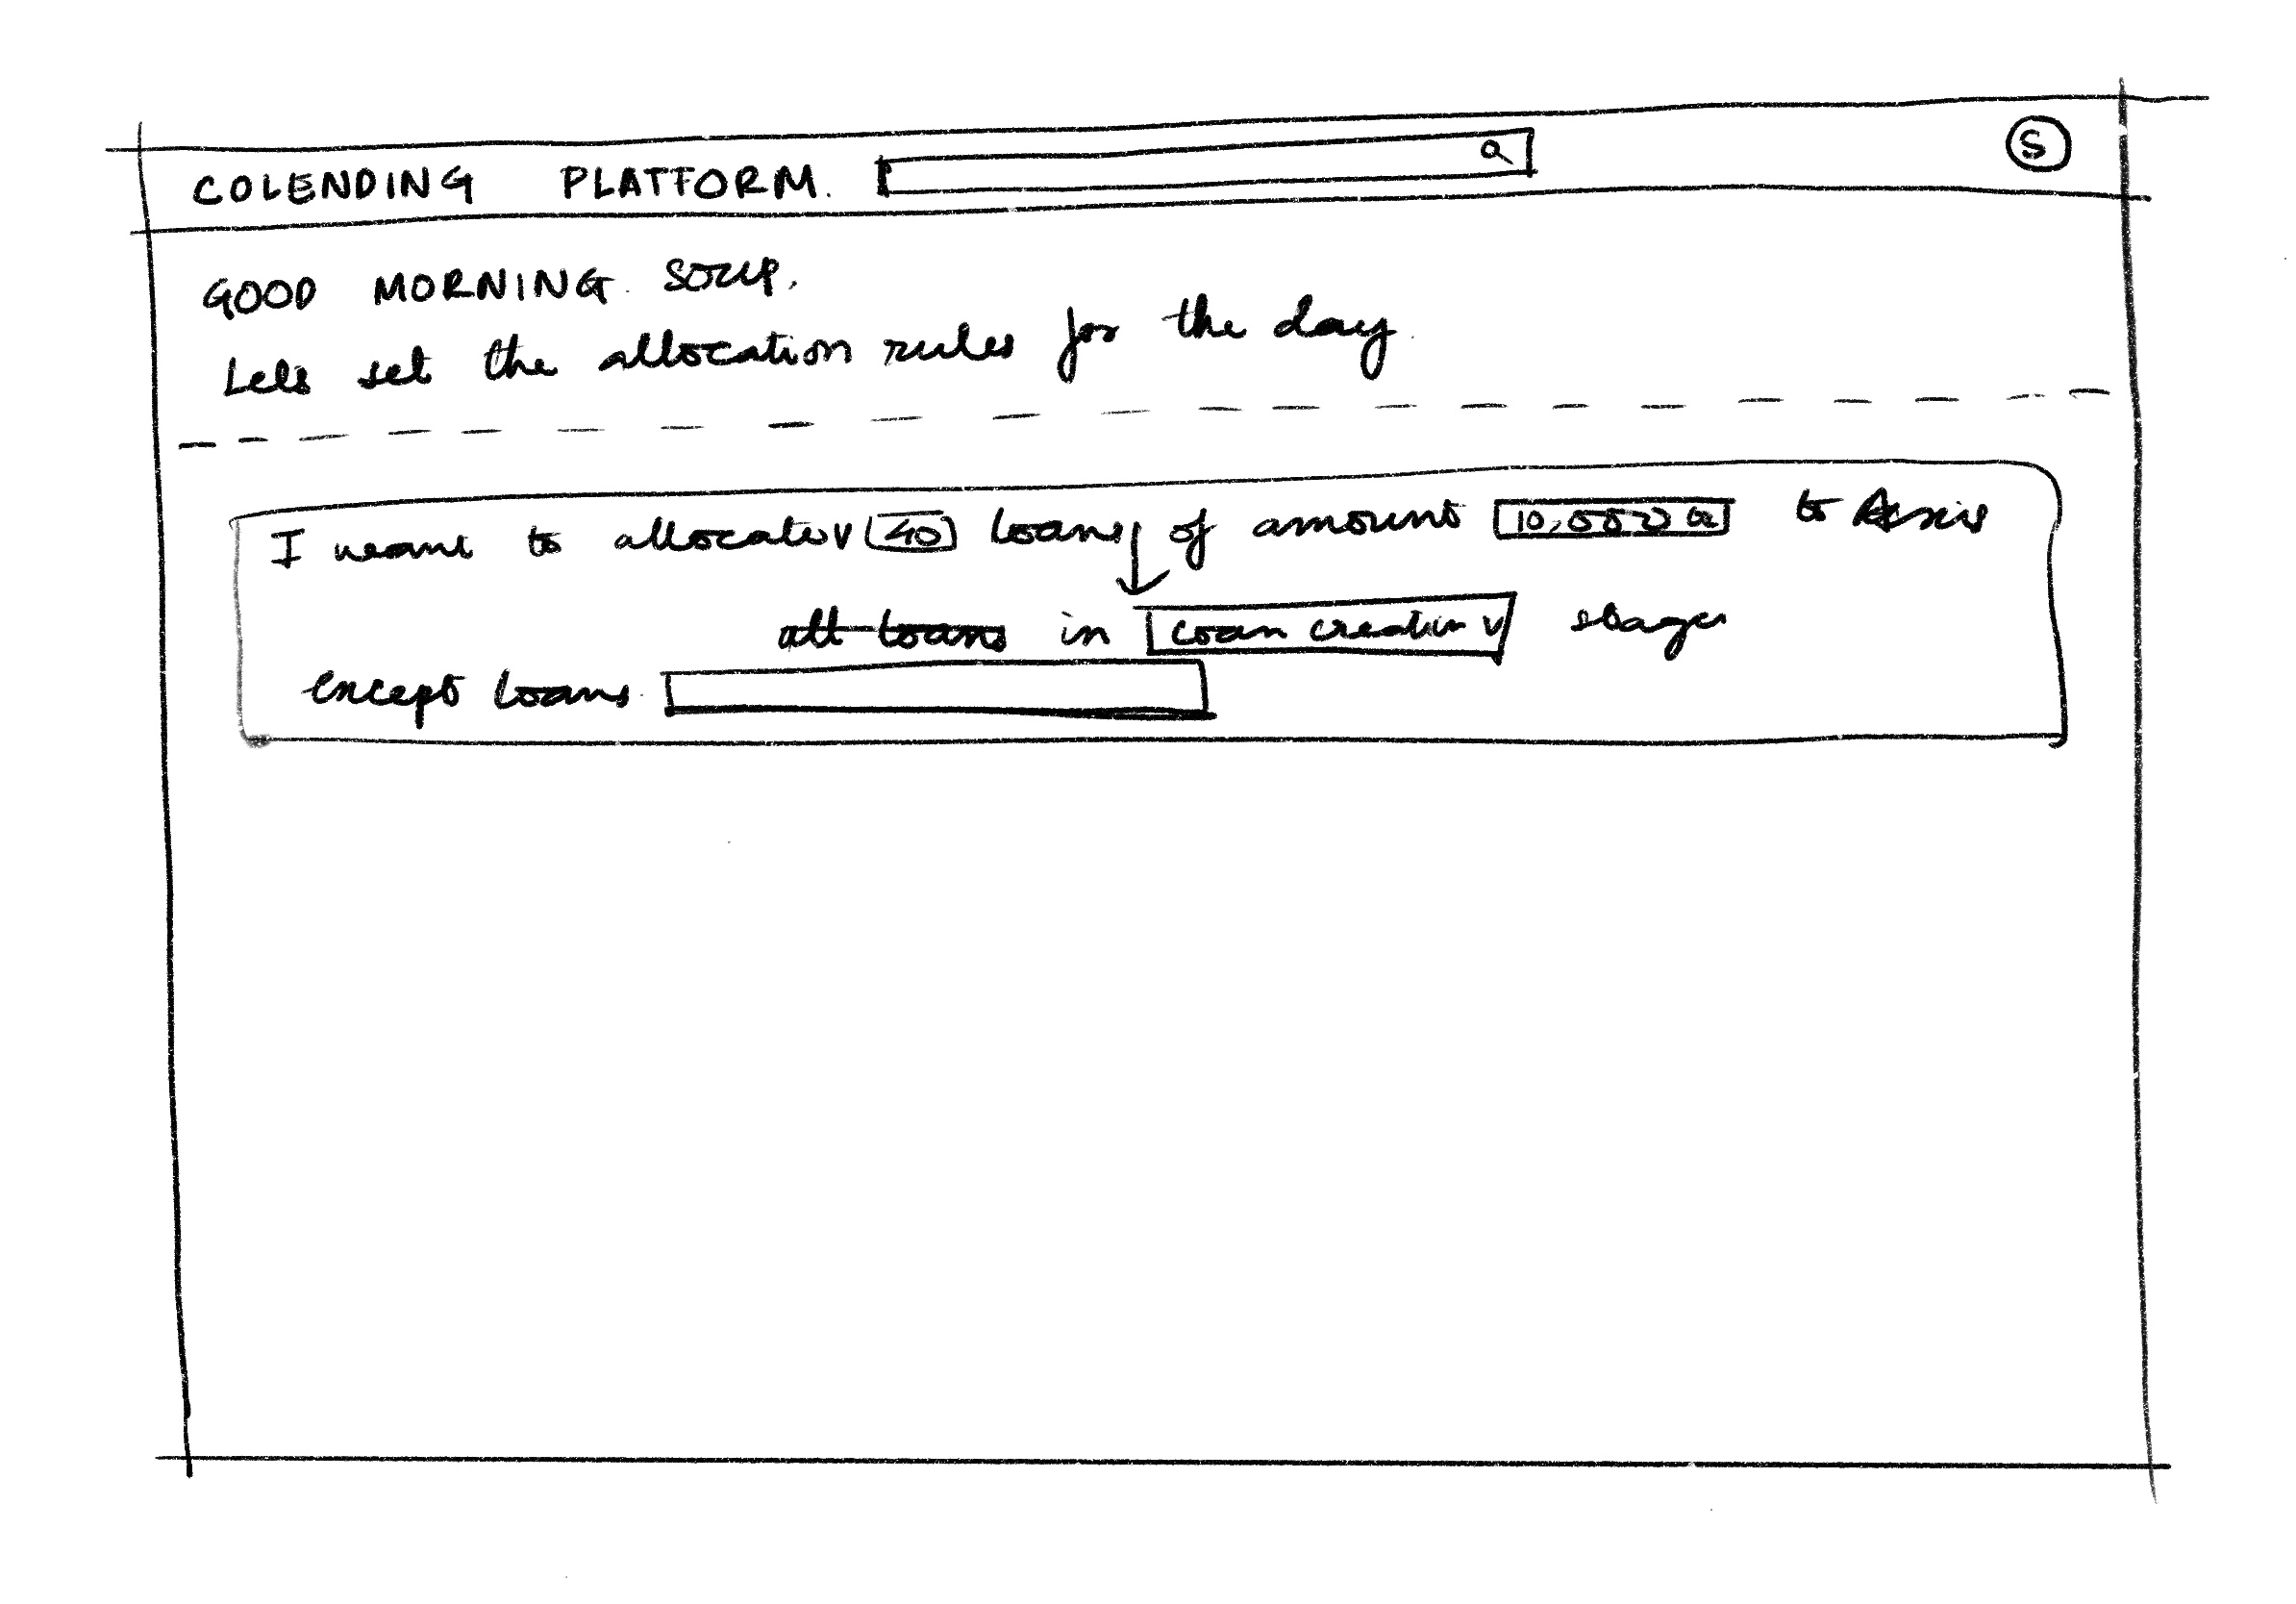
Option 3 didn’t arrive in a session. It struck mid-conversation, while talking the problem through with colleagues. The idea was fast, and so it wouldn’t escape, I jotted it straight onto the table with a marker: “I want to allocate 1,000 loans to Axis Bank, except LAN ID ___.” The sentence was the interface. The seed was sown on office furniture!

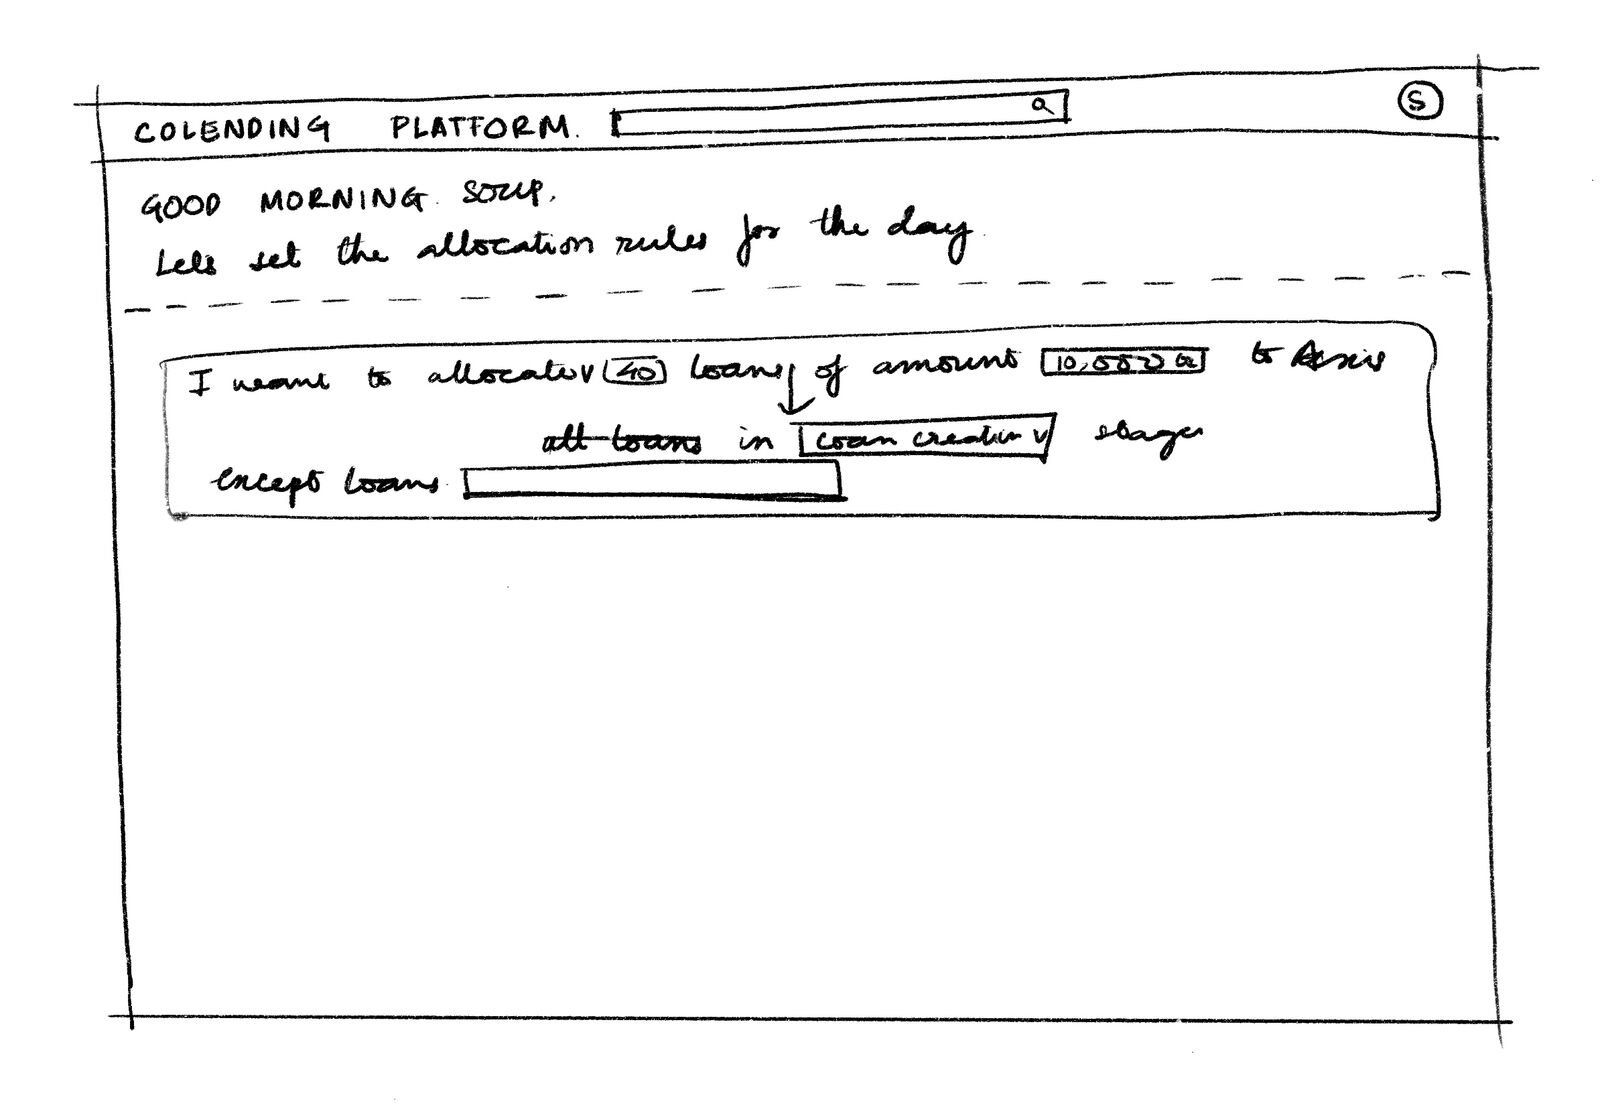
“Good morning, Soup. Let’s set the allocation rules for the day.” The rule became a fill-in-the-blanks sentence with structured inputs, readable by a human, executable by a machine. No query builder. No training manual.

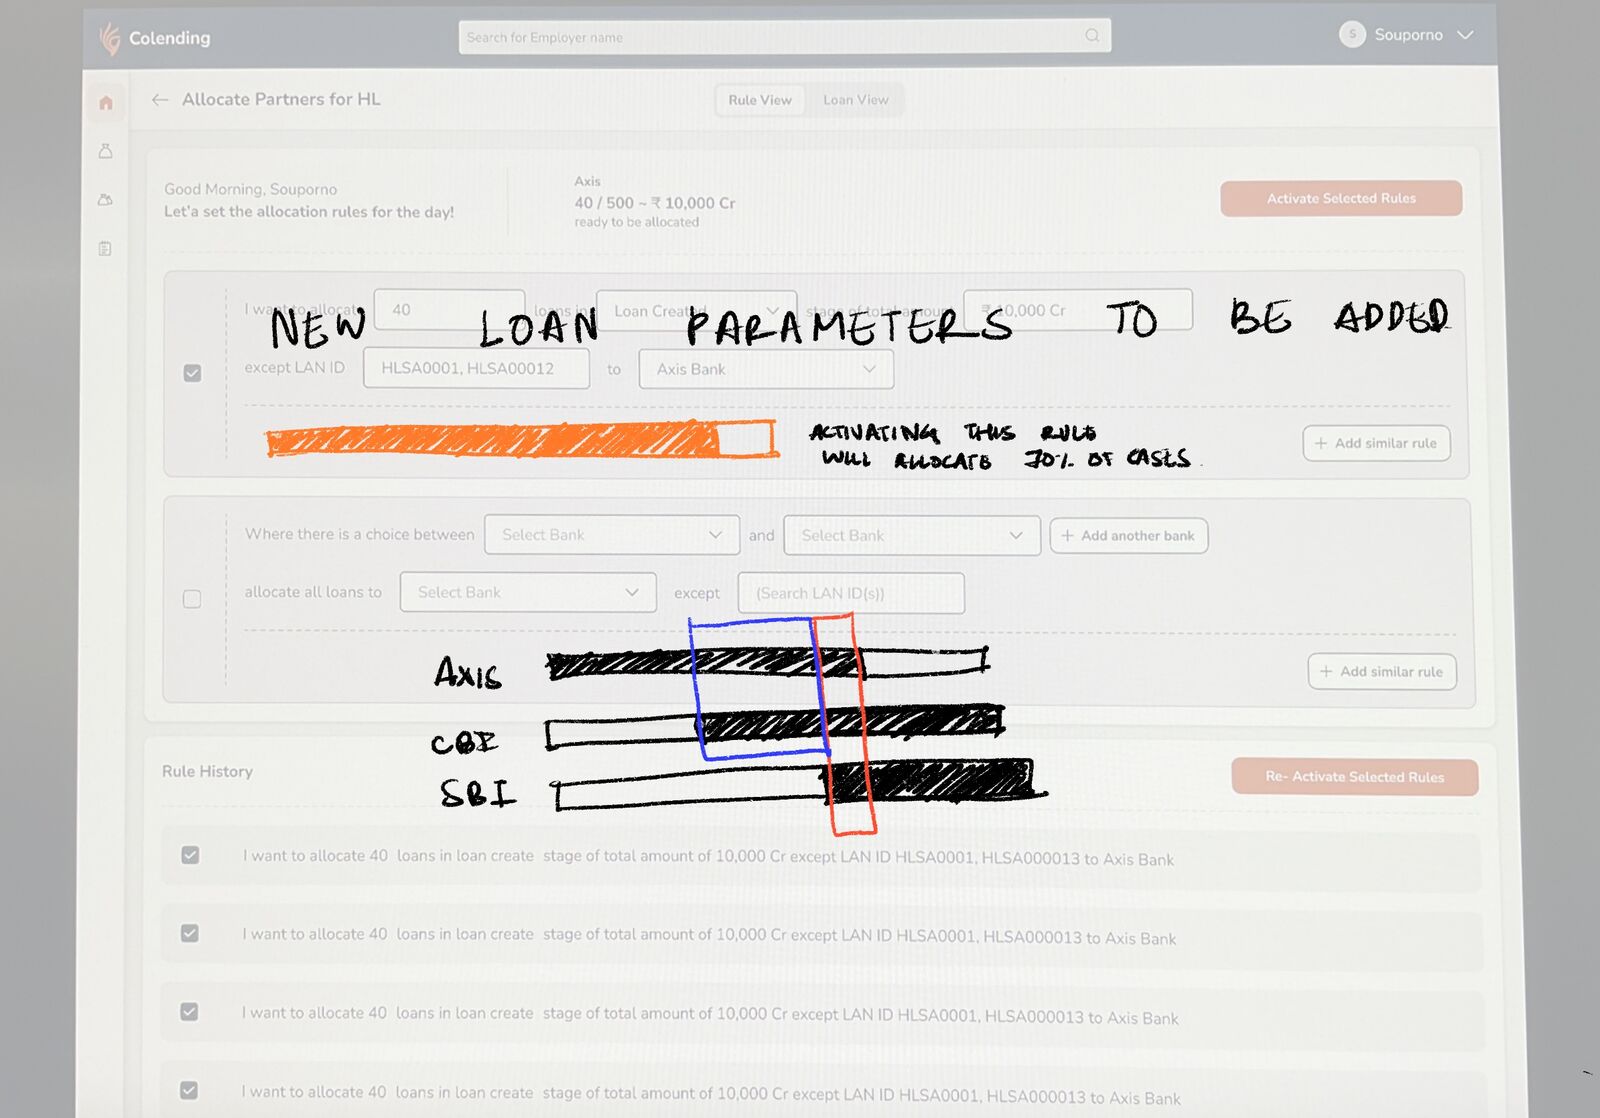
Iterating on near-final screens by hand: showing what a rule will do before it runs (“activating this rule will allocate 70% of cases”), visualising partner overlap between Axis, CBI and SBI, and keeping every activated rule as replayable history. The data visualisation part was key to making the users understand the current allocation status.
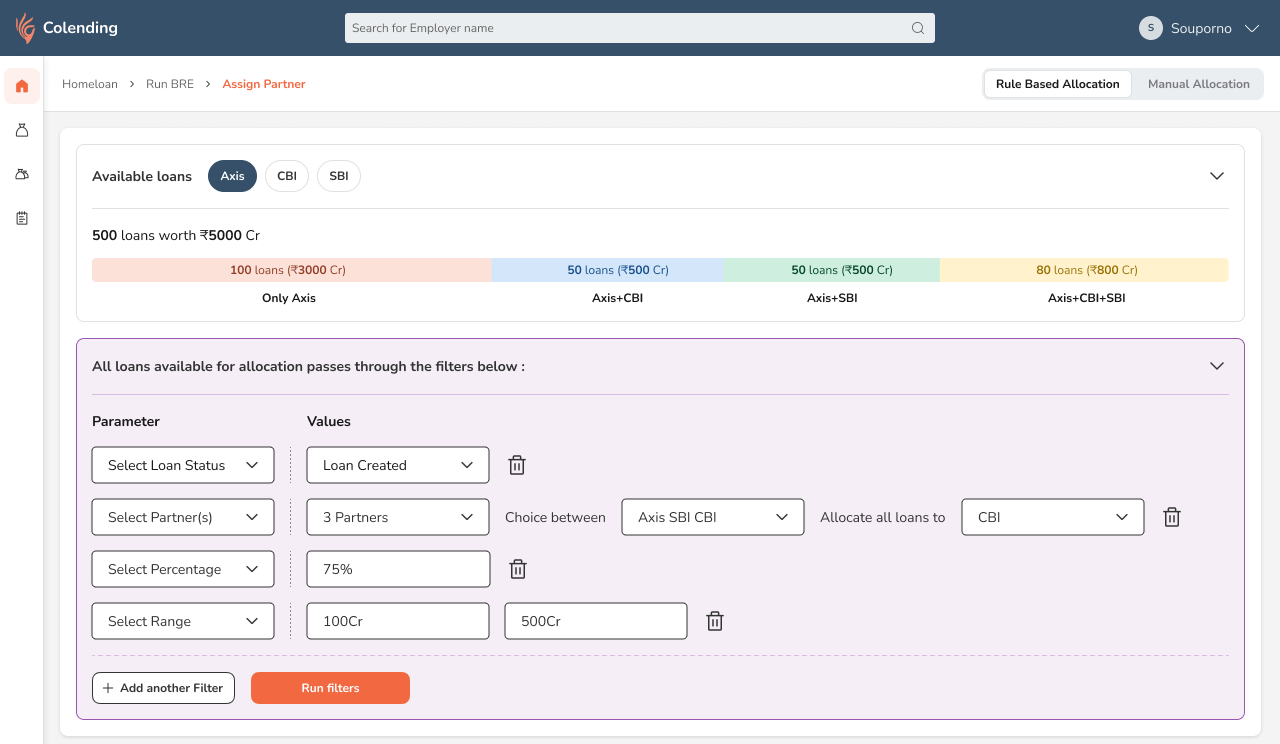
The shipped Rule Builder, recreated here. This is the actual interaction, try it.
One sentence. The BRE validates every case behind it, exclusions are respected, partner overlaps are resolved by priority, and rejected cases re-route to the next eligible bank, Axis first, SBI if Axis declines.

Drag, from first sketch to shipped screen.
The flow the platform shipped, one person, one morning, no hand-offs. The weekly meeting still happens; it’s good judgment. Everything after it now takes minutes.
The IA mirrors how Credit Strategy actually thinks: pick the book, see the state of it, act on it with rules, and account for every action. Partner banks and programs are configuration, not architecture, a new bank signs, the business team adds it, nothing gets redesigned.
The screens, in the order Deepa works them. Sweep the orb along the arc, or drag the rank, and open the one glowing green.
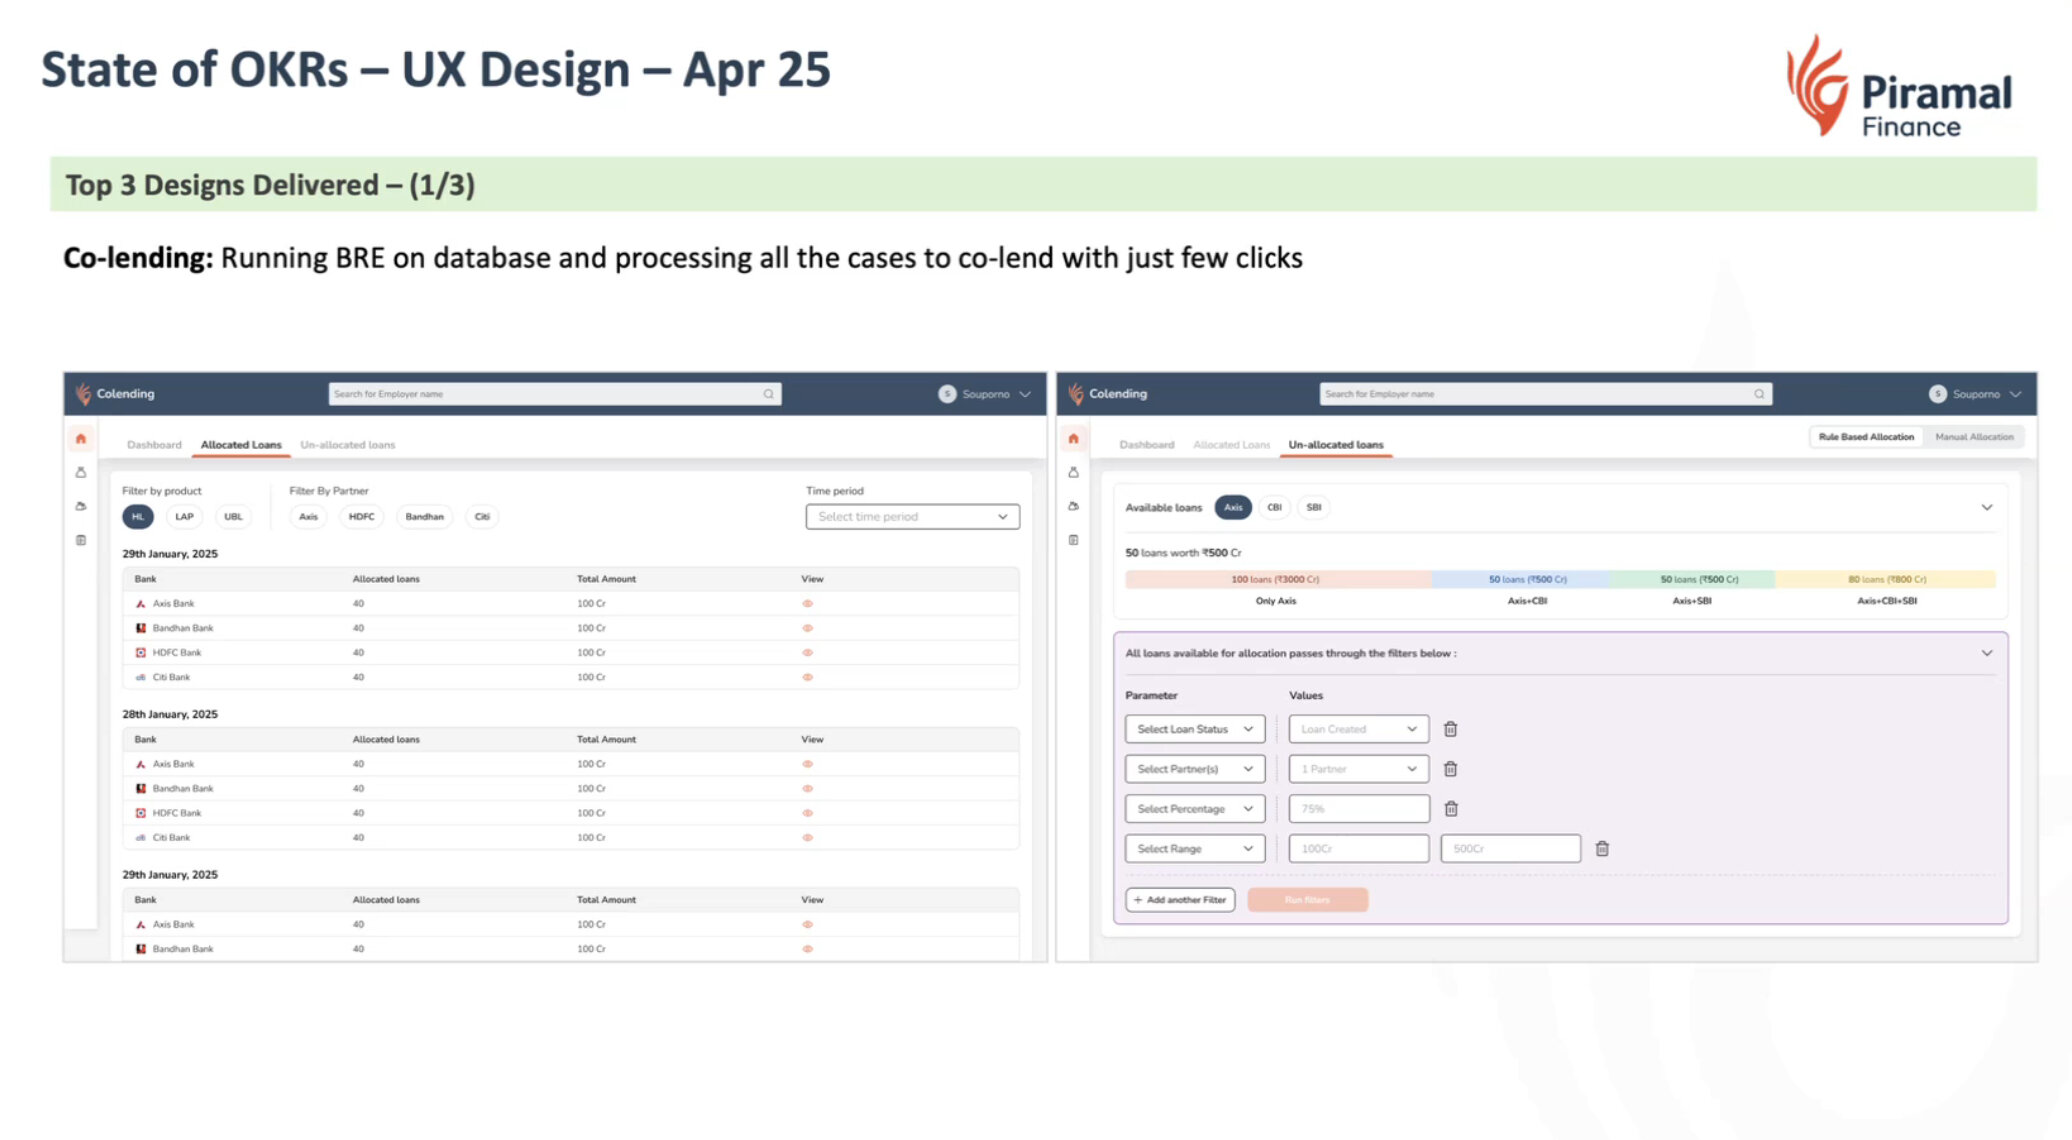
At the April ’25 company townhall, Co-Lending was showcased first among the “Top 3 Designs Delivered”, running the BRE on the whole database and co-lending every case in a few clicks. Turnaround time fell by 80%; 12,500+ leads processed; 250+ loans worth ₹55 Cr+ pushed to partners via bulk upload.
We didn’t arrive at natural language because a model made it cheap. We arrived at it because we listened to how people already spoke about their work, and built an engine that could keep up. A year later, the world decided sentences were the future of interfaces. The ops team at Piramal already knew.